Bring data, business definitions, and agents together—so teams can inspect how an answer was produced, not just read the result.
On October 20, 2026, we introduced MirrorShip Intelligence Platform (MIP), our enterprise AI data platform.
MIP brings together high-performance analytics, business definitions, contextual knowledge, and data agents. It helps organizations ask questions in natural language, explore data, investigate anomalies, and produce reports within defined data and access boundaries.
For MirrorShip, this marks an extension of our real-time analytics foundation into a unified platform for data analytics and AI.
At the launch, CEO Vincent Sun, CTO Peng Chen, and MIP Product Lead Yingting Dong explained the thinking behind the platform and demonstrated how it works. Kang Zhou from Alibaba Cloud and Bao Li from Haijie Technology shared perspectives on multimodal retrieval and the evolution of enterprise data platforms.
An answer is only useful if the business definitions are right
“What was our revenue last quarter?”
It sounds like a straightforward query. Inside a business, however, the answer depends on several decisions: which revenue definition applies, how returns are handled, and how transactions spanning reporting periods are counted.
The same is true of a question such as “Which high-value customers are at risk of leaving?” Before calculating anything, the system needs to understand what “high-value” and “at risk” mean, and how customers, orders, and marketing activity are related.
Language models are increasingly capable of producing answers. But an answer that looks plausible is not necessarily suitable for a business review. Teams need to know which definitions were applied, what data was used, and how the conclusion was reached.
Agents also change how data platforms are used. A single business question may trigger a sequence of queries, searches, and joins. The platform needs to respond quickly while applying the relevant business rules and access controls throughout the process.
MIP connects these requirements: efficient data access, explicit business definitions, and analysis that users can inspect and trace.
Three layers, one path from data to analysis
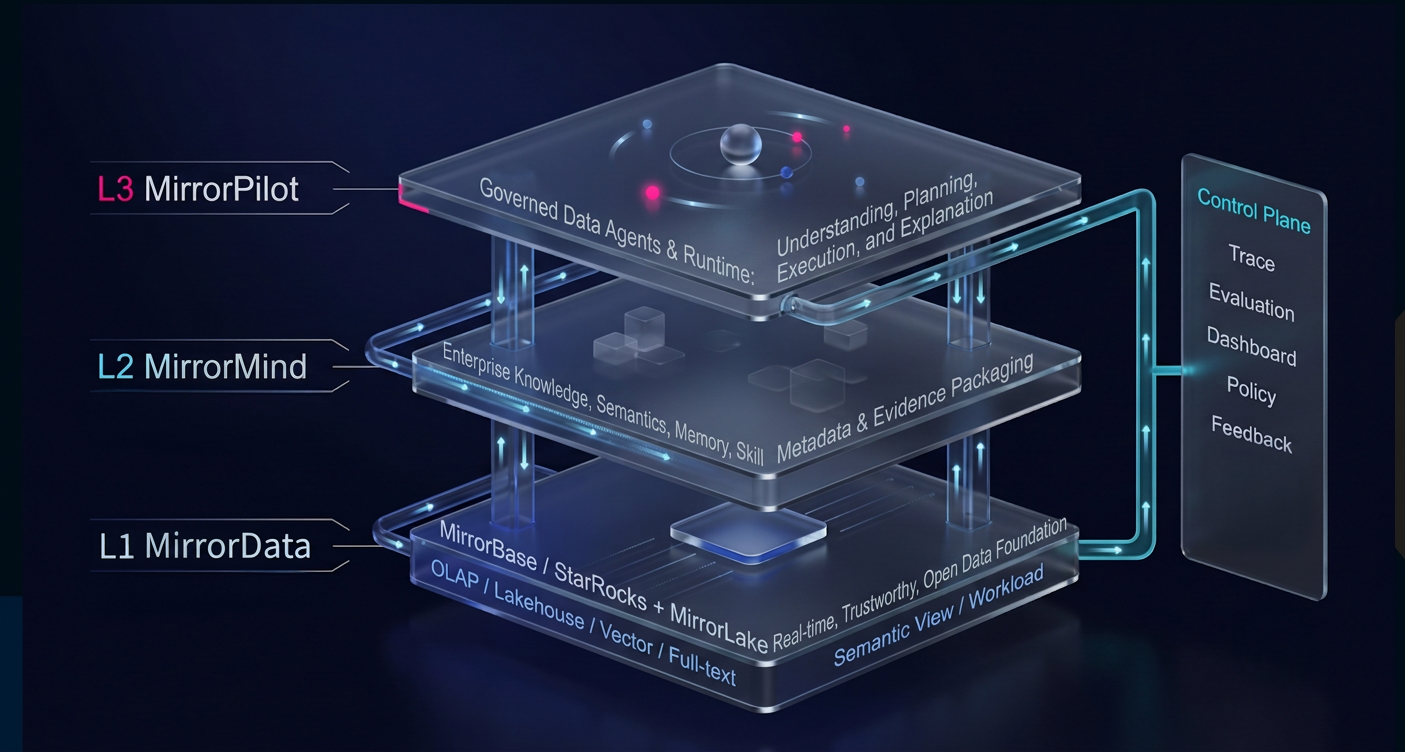
MIP comprises MirrorData, MirrorMind, and MirrorPilot. MirrorControl provides governance, security, and operational management across the platform.
StarRocks remains a core technology foundation for real-time analytics. Existing reporting, application analytics, and lake queries continue to be supported, while new AI analytics workloads can develop within the same platform architecture.
MirrorData: Access data through a shared analytics foundation
Enterprise analysis rarely involves just one type of data. A task may require transaction tables, lake data, documents, images, and vector embeddings—and the results often need to be joined before they become useful.
MirrorData provides a shared foundation for querying and analyzing this information. It combines MirrorBase, a real-time analytics engine built primarily on StarRocks, with MirrorLake for open lakehouse storage.
Reports, interactive analytics, data applications, and agents can use the same query and compute capabilities. This helps reduce repeated data copying and the need to maintain separate analytics pipelines for each application. Resource controls and workload isolation support agent queries alongside existing business workloads.
MirrorData supports native tables and lake tables, including Paimon, Iceberg, and Hive. For existing unstructured files, the original content can remain in place while associated vectors and indexes support retrieval. Retrieved records can then be joined with other data for further analysis.
MirrorMind: Define metrics once and reuse them across agents
Access to data does not tell an agent how the business wants it analyzed.
MirrorMind provides an enterprise semantic layer with two complementary components: Semantic View and Knowledge Context.
Semantic Views define how to calculate a metric: which fields to use, the level of aggregation, the relationships between tables, and the dimensions available for analysis. These definitions guide query generation and execution rather than leaving the agent to infer them each time.
Knowledge Context adds the explanation and methods around those calculations. It can include terminology, the source of a metric definition, business rules, internal documents, and standard analytical procedures. It can also connect to existing enterprise knowledge bases.
As that knowledge changes, MIP supports Git-like context versioning, including branches, version history, and access controls. Business-reviewed versions can be published for production use, allowing multiple agents to reuse approved knowledge instead of maintaining separate copies.
MirrorPilot: Bring analytics into existing workflows
MirrorPilot is a semantic-layer-driven data agent and an environment for running and delivering agent-based analytics.
When a user asks a question, the agent draws on relevant context and reusable Skills, retrieves business definitions from Semantic Views, and uses the data foundation to execute queries and gather supporting evidence.
Teams can use a standalone conversational interface or integrate the same analytics capabilities into existing BI tools, business portals, and applications through APIs. Custom Skills and SQL templates help reuse established analytical methods.
The output can be more than a written response. MirrorPilot can present charts, expose the SQL used, and generate exportable reports. Records of metrics, time ranges, calculation rules, and queries allow users to check results and ask follow-up questions.
Three demonstrations: From retrieval to a reviewable report
At the launch, Yingting Dong demonstrated how the platform’s layers work together in practical tasks.
Find relevant service records from an image
In a simulated after-sales scenario, a user uploaded an image of a damaged item. The system generated an embedding to retrieve similar records, then narrowed the results using a date range and text describing the damage.
The demonstration combined vector similarity, text search, and structured filters in a single SQL query. It showed how image retrieval can work with business conditions, rather than ending with a list of visually similar pictures.
Calculate the right budget—not just a sum of available fields
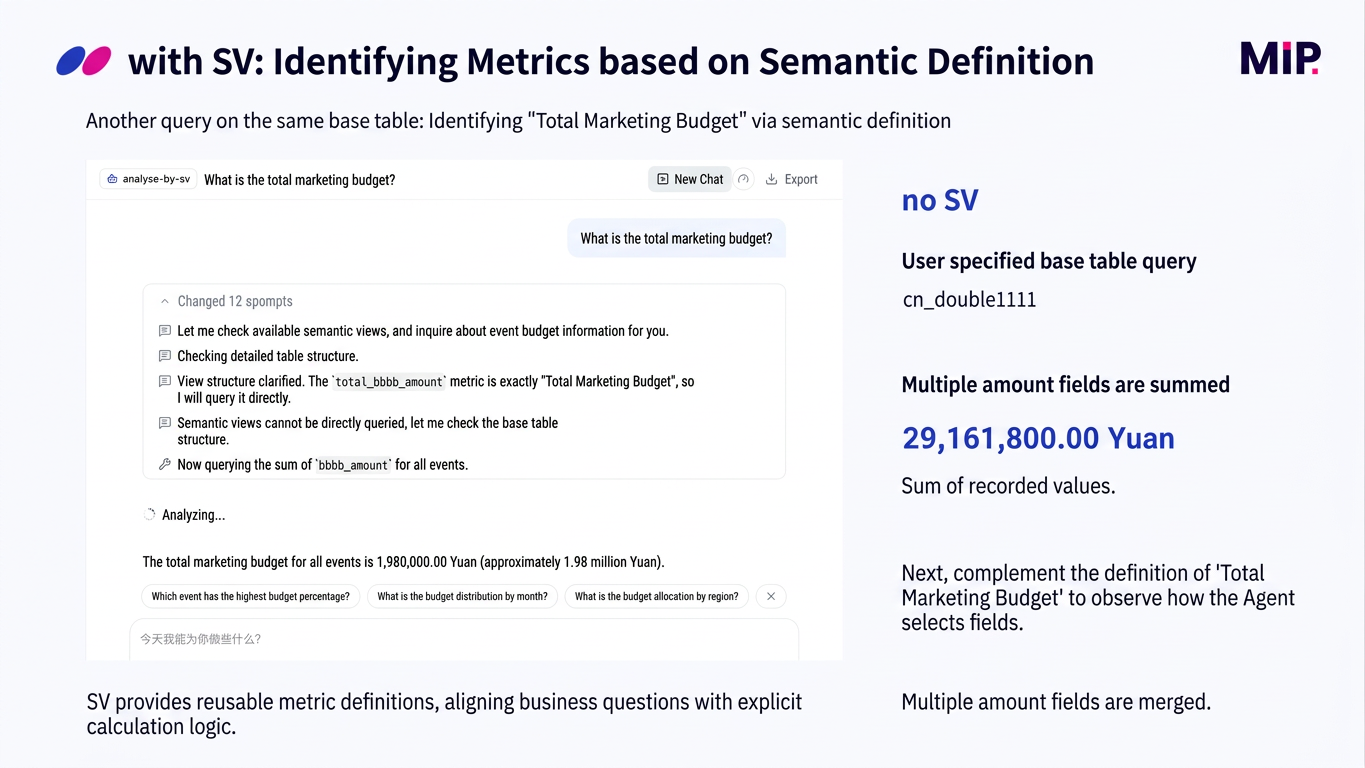
A second demonstration asked an agent for the company’s total campaign budget.
When querying the raw table directly, the agent summed several unrelated amount fields and returned an incorrect result. With a Semantic View, it first identified the defined budget metric, then used the specified field and aggregation rule.
The distinction matters: SQL can execute successfully while answering the wrong business question. Explicit metric definitions give the agent a calculation to follow instead of a choice to guess.
Investigate a retail anomaly and generate a report
A retail analytics example showed the full workflow, from configuring an agent to delivering its results.
The agent’s configuration established its data scope, Semantic Views, knowledge base, and Skills. Users could then explore sales by channel and ask follow-up questions about whether order cancellation rates were unusual and what might explain the change.
The agent used the company’s anomaly rules and standard analytical procedures to investigate further. It presented supporting queries and evidence, then generated an HTML report containing charts and a summary of the analysis.
Users could review not only the conclusion but also the metrics, time ranges, and SQL behind it.
Retrieval becomes more valuable when it connects to analysis
The launch also explored how enterprise data platforms are evolving to support AI beyond conversational analytics.
Kang Zhou described how StarRocks and Paimon work together for multimodal retrieval. Original images and videos remain in object storage, while extracted text, labels, and vectors are linked to the relevant samples. Structured filters, full-text search, and vector search help identify relevant content, which can then be analyzed alongside business records.
In the Alibaba Group A Lake example he presented, Paimon wide tables connect multimodal samples with their features, while Alibaba Cloud EMR StarRocks provides hybrid retrieval and filtering for training-data preparation.
In autonomous-driving workflows, the task goes further: engineers need to connect retrieved clips with vehicle information, model versions, and evaluation records. This helps them investigate failures, find similar examples, and assess whether existing data covers the conditions they need.
These examples also clarify the division of responsibility. The data platform organizes, retrieves, and analyzes information; collection, annotation, training, and deployment systems contribute the other parts of the workflow.
Bao Li discussed a related shift in financial services. Contracts, due diligence reports, and collateral images need to be connected with transactions, accounts, and business metrics. At the same time, reporting, regulatory batch jobs, and conversational analytics place different demands on platform resources.
The goal is not to discard existing warehouses and lakehouses. It is to build on those assets, make unstructured information usable in analysis, and support frequent access by both people and agents.
Start with a defined business problem
Putting AI analytics into use involves more than connecting a model to a database. It requires decisions about data scope, metric definitions, knowledge maintenance, access permissions, and validation.
MIP is not designed around unrestricted “ask anything” analytics. As Vincent Sun emphasized, reliable enterprise AI needs trusted data domains, explicit business definitions, and people who can review and correct the results.
A practical starting point is a defined analytical task: establish the data and metrics, connect the relevant knowledge and procedures, and evaluate results with the business team before expanding the scope.
From real-time analytics to lakehouse queries and now data agents, the objective remains the same: help enterprises put their data to work. MIP extends that foundation with shared business definitions, governed access, and analysis that users can review.
Launch replay: https://mirrorship.ai/en/events/mip-launch